How to Add GPS Data in QGIS
Let's start this tutorial by adding a GPS data into QGIS. Firstly we have to get the data from a GPS device in a GPX format. To get the data, we only need to plug a GPS device using an USB cable to a laptop or PC and access the internal GPS storage.
For this tutorial I use a GPX data which is called
ride.gpx. Please free to download
the data so you can get practice it right away.
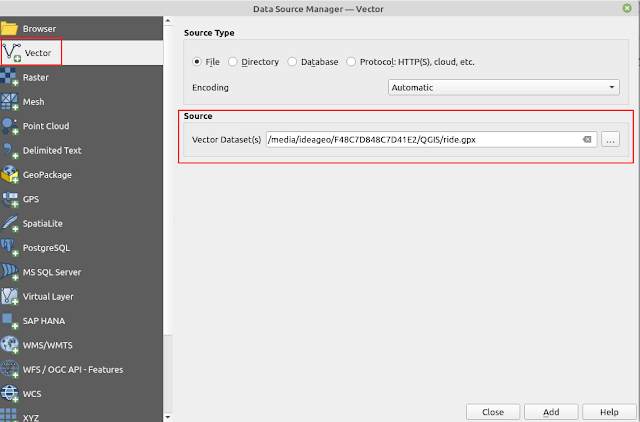
After getting a GPX data, we can add the data using the 'Data Source Manager'. From the top toolbar menu select Layer > Data Source Manager. The Data Source Manager window will appear as in figure 1. On the left panel select 'Vector'. Then in the right panel make sure to select 'File' in the Source Type option and in the Source browse to a GPX data.

|
|
Figure 1. Data Source Manager Window |
After pushing the 'Add' button, a Select Items window will
show up as seen in the figure 2. In this window we can select which item
to add into QGIS map canvas. Might be not all items contain data,
because we didn't collect all the items in the field. For the
ride.gpx data there is only tracking data, therefore it only has
tracks and track_points data. In short you can add all
items and will find empty data for items that you didn't collect or
create which you can remove later.

|
|
Figure 2. A GPS Data Items |
After selecting GPS data items and pushing the
'Add Layers' button, the GPS data will be added into QGIS map as
in the figure 3. For clarity whether you get the right position, I
suggest to ada a basemap layer into the map. You can add a basemap into
QGIS easily using
Tile+
plugin.

|
|
Figure 3. GPS Data in QGIS Map Canvas |
How to Export GPS Data to A Geospatial Data Format
Congratulation! You have seen a GPS data that you'd collected in the field. Anyway the data still in GPX data format. Basically a GPX data is a XML data format. Next how to export it into a geospatial data format like GeoJSON, Geopackage, Shapefile, etc.
To export a GPS data item into a geospatial data format is straight forward. Right click on the item you want to export then select Export > Save Feature As... as in the figure 4.

|
|
Figure 4. Export GPS Data |
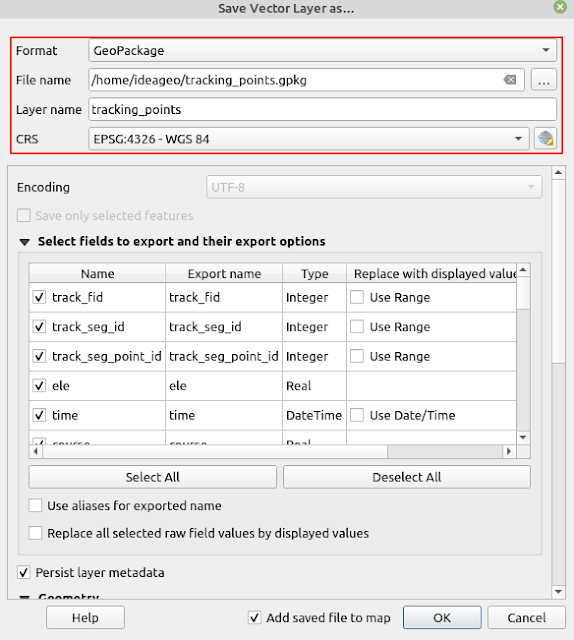
After that a window will appear as in figure 5. In this window you can
select a geospatial data format, give a name for the exported data item
and define a coordinate reference system.

|
|
Figure 5. GPS Export Data Options |
Animate GPS Tracking Data
As we all know tracking data is recording while an object or a person is moving in the field. It's very useful to observe where and how an object is moving in term of it's location, time and speed. There are many applications can be utilized this tracking data such as transportation, logistics, animal migration, and so on.
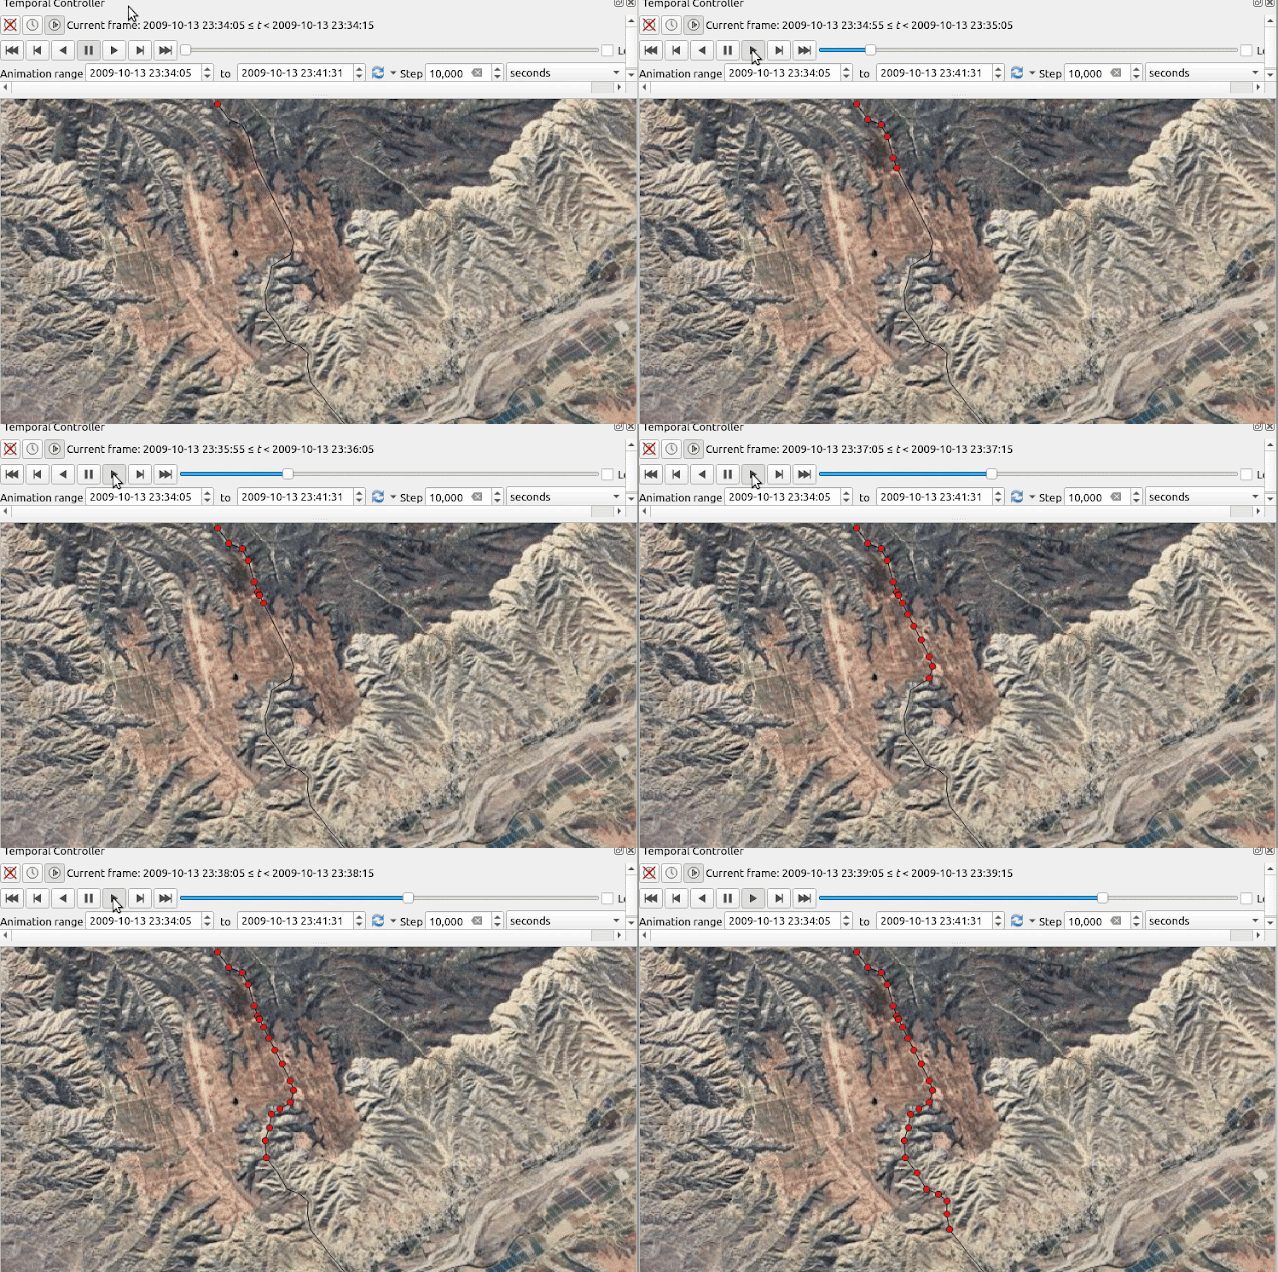
Because it's a dynamic data, of course it will be interesting if it can be animated. We can do it easily in QGIS using the Temporal Controller.
To create a GPS tracking animation, follow the following steps:
1. Right click the track_points layer and select 'Properties'.
2. In the properties window as in figure 6, select the
'Temporal' option in the left panel. On the right menu make sure to
enable the Dynamic Temporal Control option. In the Configuration
select 'Single Field with Date/Time' option. For field choose the 'time'
column and lastly check the 'Accumulate features over time'.

|
|
Figure 6. Layer Properties Temporal Options |
3. Enable the Temporal Controller tool. You can access it from View > Panels> Temporal Controller.
4. The Temporal Controller tool will be visible within QGIS, as shown in
Figure 7. It's crucial to focus on the 'Range' option, ensuring it
aligns with the time and date indicated in the time column of the
tracking data. If they don't match, simply click the 'Refresh' button
located on the right-hand side.

|
|
Figure 7. Temporal Controller Tool in QGIS |
How to Visualize Elevation Profile of GPS Track
In the last section let's visualize elevation profile along a GPS track data. For this purpose we're using the Profile Tool plugin. Make sure you already install the plugin. The plugin can be found in the Plugins menu as in shown in the figure 9.

|
|
Figure 9. Terrain Profile Plugin |
In the Profile tool window. Add the selected track_points layer. In
the selection select 'Selected Layer'. The elevation profile of
tracking data will be displayed as in figure 10.

|
|
Figure 10. GPS Tracking Elevation Profile |
That's all this tutorial on how to visualize GPS data in QGIS. We've covered
some technical approaches such as: how to add GPS data into QGIS map, export
a GPS data item into a geospatial data format, animate the tracking data and
visualize the elevation profile of tracking data. I hope this post is
useful. Thank you for reading!


