Getting Earthquake and Country Boundary Data
In the previous post about cluster point mapping, I mentioned that earthquake data can be downloaded from the USGS earthquake catalog search. This website allows you to download earthquake events from around the world within a specified time frame. For this tutorial, I downloaded earthquake data for the year 2022.
To obtain boundary data, you can refer to the World Bank data catalog, where you can find boundary information for various countries, including disputed territories (although we won't focus on those for this tutorial). I obtained a World Boundaries GeoJSON file with very high resolution, which is approximately 19.4 MB in size.
Adding the Data into QGIS
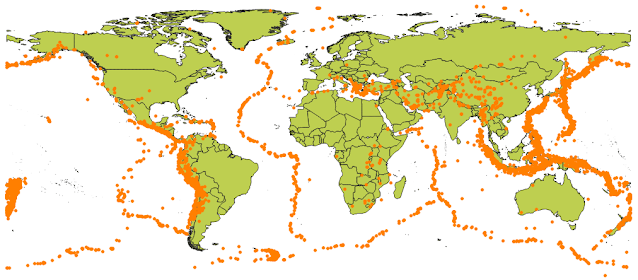
After downloading the data, let's add the data into QGIS map. You can do it simply by Adding Vector Data from the Data Source Manager. Figure 1 below shows both data were added into QGIS.
 |
| Figure 1. 2022 Earthquake events |
Calculate Summary Statistics for Features
Now let's calculate summary statistics for the earthquake data. We want to calculate the number of earthquake events that took place on the land of each country, including minimum magnitude, maximum, mean and median magnitude. He are the steps:
1. From the top toolbar select Processing > Toolbox. The Processing Toolbox window will appear as in figure 2. From the search menu type: select attribute. Some related tool will be shown in the window. Select Join attributes by location (summary).
 |
| Figure 2. Join attributes by location (summary) tool |
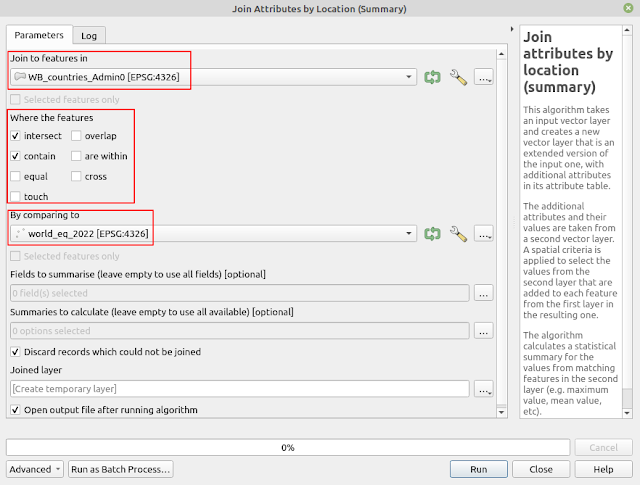
2. The Join attributes by location summary window will appear as seen in the figure 3. From the window you will see many options that have to define correctly in order to get the correct result. The first one is Join to features in. This option specify the base layer to be joined with other layer. It means the attributes from this layer will be joined with another layer, so it will not change.
 |
| Figure 3. Parameter settings for Join attributes by location (summary) tool |
3. If you want to only join the selected features, enable the Selected features only option. As I want to join all the features, I just skip this option.
4. Next in the Where the features option, select the spatial relationship option that relevant for your case. In this case, I want to summarize earthquake events on the land of each country. Therefore I chose: Intersect and Contain. Which means I want to select all country lands that intersect with earthquake points and also it contains the earthquake points.
5. In the By comparing to option, select the earthquake data, since we want to join this data into the world boundary .
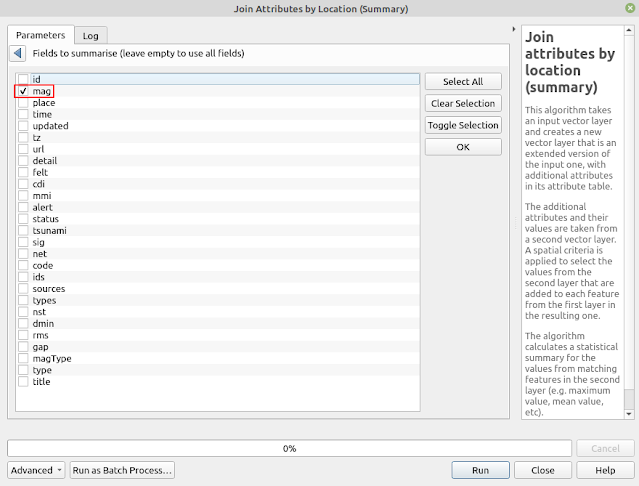
6. In the Fields to summarize options, select fields you want to summarize. In this case I want to summarize based on earthquake magnitude field. Therefore I selected the mag field as seen in the figure 4.
 |
| Figure 4. Selecting fields to summarize |
7. Next option is defining what statistics parameter we want to calculate. This can be done from the Summaries to calculate option. Selecting this option through the triple dots button on the right, all fields from the earthquake layer will appear as in figure 5. For this case I want to calculate the number of earthquake events on the land (count), minimum, maximum, mean and median magnitude.
 |
| Figure 5. Selecting statistics parameter to calculate |
8. Next option is Discard records which could not be joined. As it's name it will discard all features of world boundary which not have earthquake points in it. It depends on you, whether you want to discard it or not by enabled this option.
9. The last option is Joined layer where to specify the output location from the result. You can specify one, or just leave it empty to store it in the temporary location. All done. Now what you need to do is clicking the Run button to execute the process.
10. After it finish. A joined layer will be added into QGIS map. Open the attribute table, you will find all statistics calculated parameters as shown in the figure 6.
 |
| Figure 6. Statistics summary result |
Plotting the Graph
Before ending this tutorial let's plot a graph that shows the number of earthquake events that happened on the land of each country using DataPlotly plugin with the following steps:
1. From the Plugins menu on the top toolbar, select DataPlotly. If it's not appear in the toolbar menu, please install the plugin first.
2. The DataPlotly window will show as seen in the figure 7. In the Plot type select Bar Plot. Then in the Plot Parameters options choose the Joined layer and select corresponding field for X and Y.
 |
| Figure 7. DataPlotly Plot Parameters |
3. Next move to the Layout Options. Here you can set the title of the graph, change the name of X and Y axis as shown in the Figure 8.
 |
| Figure 8. DataPlotly layout options |
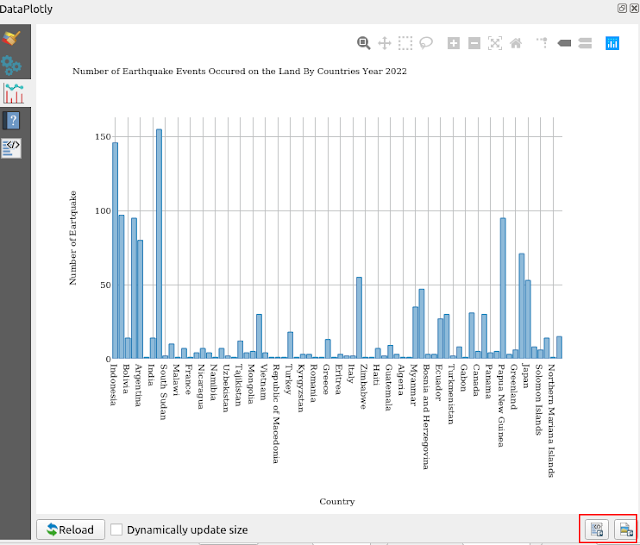
4. Click the Create Plot button. The bar chart that summarize number of earthquake by country will be generated as in figure 9. If you want to change the plot parameters or layout properties you can do it directly in the DataPlotly window, but don't forget to click Update Plot button to refresh the graph.
 |
| Figure 9. Bar chart that summarized the number of earthquake events by country |
5. Lastly you can export the graph as image or HTML using the buttons on the bottom right of the window as marked with red rectangle in the figure 9.
