Most spatial data is represented using point geometry, such as tourism spots,
trees, boreholes, earthquake locations, and more. In essence, point geometry
can be used to represent the majority of places on the Earth's surface.
However, when visualizing a large number of points on a map, it can become
overwhelming. The map becomes cluttered with numerous dots, resembling a
scramble in a confined space. To address this issue, we can utilize a point
clustering technique.
In this tutorial, I will demonstrate how to
create a cluster map using
Leaflet,
focusing on a specific use case: World Earthquake events in the last 30 days.
At the end of the tutorial we will get a web based interactive cluster map as
shown in the figure 1.

|
|
Figure 1. Points Cluster Map |
Getting Earthquake Data
The United States Geological Survey (USGS) is a government agency that offers
reliable data on earth science and systems, including earthquakes. USGS
records earthquake events worldwide, archives the data, and provides free
access to it. You can search for and download the data from the
Earthquake Catalog Search.
In the Earthquake Catalog Search page, you will find three options: Basic,
Advanced, and Output Options. The Basic option allows you to specify the
minimum earthquake magnitude, date and time, and geographic region, as shown
in Figure 2.

|
| Figure 2. Basic options of earthquake catalog search |
The Advanced options offer various items that can be specified, such as
geographic region, depth, event type, impact, and more. However, since we want
to download all earthquake events, we can simply leave this option.
Lastly, the Output options offer various data formats for download, such as
CSV, KML, QuakeML, and GeoJSON. Please select GeoJSON for this purpose.
After
clicking the Search button at the bottom of the page, the results will open in
a new web page, as shown in Figure 3. Select all the text and paste it into a
text editor application. Remember to save it with a .geojson extension.

|
|
Figure 3. Data in geojson |
Before creating the cluster map, let's verify that we have obtained the data
correctly by viewing it with GIS software. You can use any GIS software of
your choice, but for this tutorial, we will be using QGIS. In QGIS, add the
data by going to Data Source Manager > Vector. If the data is
working properly, you should be able to see all the earthquake events on the
QGIS map. To provide a reference, you can add a basemap. In QGIS, you can
select various basemaps using the
Tile+
plugin. Figure 4 displays all the earthquake points from the last 30 days on
the OSM basemap.

|
|
Figure 4. Earthquake events |
Create Cluster Map
After downloading the data and verifying it works fine. Now let's create cluster map. For this purpose we are using Leaflet. Leaflet is a prominent open-source JavaScript library renowned for its mobile-friendly interactive maps with a compact size less than 50 KB.
Below is step by step how to create cluster map using Leaflet JS.
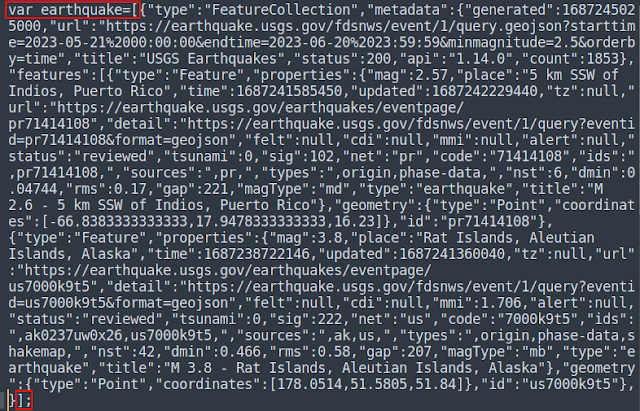
1. Give a variable name for the downloaded earthquake data in the geojson format. Take a look the figure 5. Can be seen in the figure, I added a variable name with a var statement with a name earthquake. Make sure to close with ]; at the end of the file.

|
|
Figure 5. Modify GeoJSON Data |
2. Copy the code below and paste into a text editor. I don't explain the code but it's self explanatory cause I added comments in each part.
1 2 3 4 5 6 7 8 9 10 11 12 13 14 15 16 17 18 19 20 21 22 23 24 25 26 27 28 29 30 31 32 33 34 35 36 37 38 39 40 41 42 43 44 45 46 47 48 49 50 51 52 53 54 55 56 57 58 59 60 61 62 63 | <!DOCTYPE html> <html> <head> <title>Earthquake Cluster Map</title> <!-- LOAD LEAFLET JS LIBRARY !--> <link rel="stylesheet" href="https://unpkg.com/leaflet@1.9.4/dist/leaflet.css" integrity="sha256-p4NxAoJBhIIN+hmNHrzRCf9tD/miZyoHS5obTRR9BMY=" crossorigin=""/> <script src="https://unpkg.com/leaflet@1.9.4/dist/leaflet.js" integrity="sha256-20nQCchB9co0qIjJZRGuk2/Z9VM+kNiyxNV1lvTlZBo=" crossorigin=""></script> <!-- LOAD CLUSTERMAP JS LIBRARY !--> <link rel="stylesheet" href="https://unpkg.com/leaflet.markercluster@1.0.3/dist/MarkerCluster.css" crossorigin="" /> <link rel="stylesheet" href="https://unpkg.com/leaflet.markercluster@1.0.3/dist/MarkerCluster.Default.css" crossorigin=""/> <script src="https://unpkg.com/leaflet.markercluster@1.0.3/dist/leaflet.markercluster-src.js" crossorigin=""></script> <style> html, body { height: 100%; margin: 0; } </style> </head> <body> <!-- INITIATE A MAP DIV !--> <div id="map" style="width: 100%; height: 100%;"></div> <!-- GEOJSON DATA !--> <script type="text/javascript" src="data/earthquake.geojson"></script> <script type="text/javascript"> //OSM BASEMAP var tiles = L.tileLayer('https://{s}.tile.openstreetmap.org/{z}/{x}/{y}.png', { maxZoom: 18, attribution: '© <a href="https://www.openstreetmap.org/copyright">OpenStreetMap</a> contributors' }); //ADD BASEMAP TO THE MAP var map = L.map('map').addLayer(tiles); //INITIATE GEOJSON DATA VARIABLE var geoJsonLayer = L.geoJson(earthquake, { onEachFeature: function (feature, layer) { const mag=feature.properties.mag //get magnitude const place=feature.properties.place //get place attribute const url=feature.properties.url //get url attribute layer.bindPopup(mag+'<br>'+place+'<br>'+'<a href='+url+' target="_blank">More</a>'); //popup window } }); //INITIATE MARKERS VARIABLE var markers = L.markerClusterGroup(); markers.addLayer(geoJsonLayer); map.addLayer(markers); //FIT MAP VIEW WITH MARKERS BOUNDARY map.fitBounds(markers.getBounds()); //ADD DATA ATTRIBUTION map.attributionControl.addAttribution('Earthquake Data © <a href="https://earthquake.usgs.gov/earthquakes/search/">USGS</a>'); </script> </body> </html> |
3. Change the geojson data source with yours in line 27. I put the data in a folder which is called data. Therefore the path is src= 'data/earthquake.geojson'. Make sure this one is correct for you.
4. Save the file into a .HTML format. Open it with a web browser application. If there is no error found. You should see the cluster map as in figure 1.
