A few months ago, some colleagues of mine spoke very enthusiastically about
ChatGPT. Honestly, I didn't pay much attention to ChatGPT because I was
preoccupied with my project. However, ChatGPT generated a lot of buzz, and I
became curious. After trying it out and asking several questions, I was
impressed with the responses. I even requested ChatGPT to create some code,
which worked for the most part, although there were occasional errors that
needed fixing. Overall, ChatGPT is a new, popular technology that can be
beneficial in many areas, including creating maps.
In this post I will show you how to use ChatGPT to create a map, with a use
case: Top nickel production countries/region in the world.
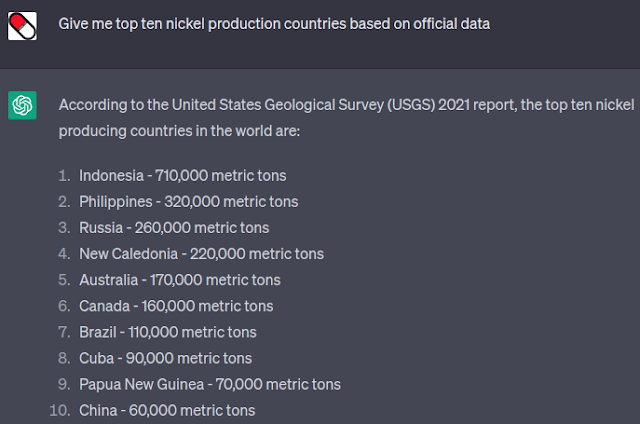
Firstly let's ask ChatGPT to show us top 10 nickel production countries in the
world as seen in the figure 1.
Great! It gave us the top ten nickel producing countries also with the number
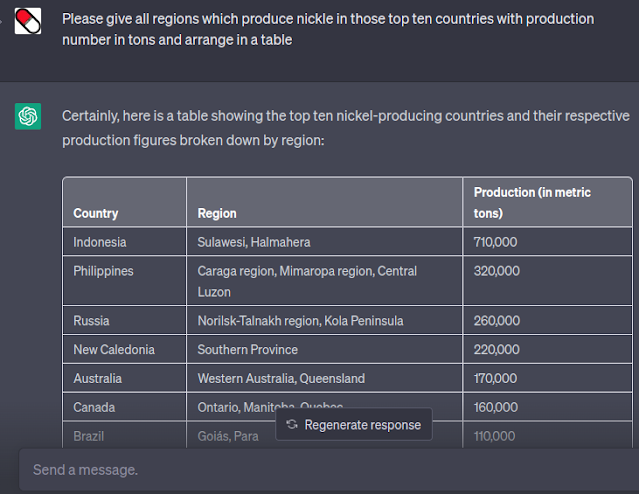
of production in tons. Then ask the ChatGPT each region in those countries
with production in tons and arrange the result in a table as shown in the
figure 2.

|
|
Figure 2. ChatGPT response for regions in the top ten nickel producing
countries |
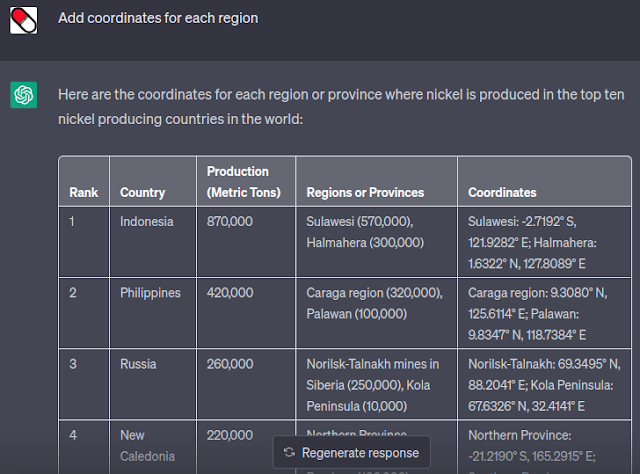
Now, we got the country, regions for each country that producing nickle with
it's production in tons. Anyway, to make a map that shows the respective
regions, coordinates are required. For that ask ChatGPT to add coordinates in
the table as the following figure 3.

|
| Figure 3. Coordinates of each region in the top ten nickel producing countries |
We have all coordinates. Now let's ask ChatGPT to plot them in a map using
Geopandas.
The ChatGPT will generate the code as shown in the figure 4. Copy the code and run it in a jupyter notebook or another framework. If there is no error, it will give the result as in figure 5.
We had the map, but it seems something is missing. We don't know the name of
the markers/points on the map. For that ask the ChatGPT to add a region's name
for the label using this prompt:
add region's name for label for each points. The ChatGPT will
generate a new response writing the same code with including adding label for
each point with region's name. Copy the code again and run it in the Jupyter
notebook. Now you will find a label for each point on the map as in figure 6.
So far we had created a static map using a help from ChatGPT. Before
closing this post. Let's create a dynamic map which enabled us to do zoom in,
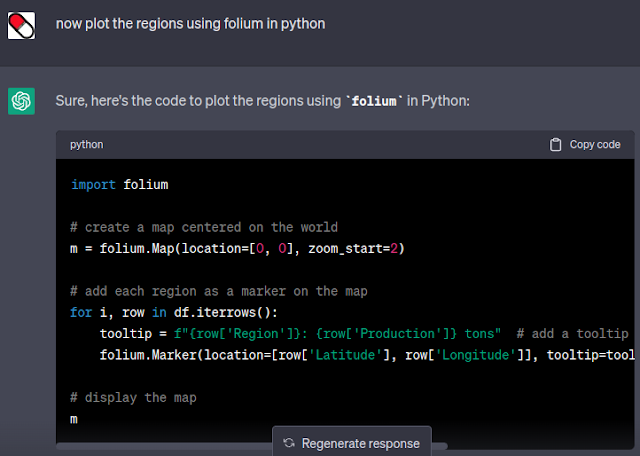
zoom out and panning. So it's more interactive for user. For that we ask
ChatGPT to plot the map using Folium library as in figure 7.

|
|
FIgure 7. Plot the map using Folium |
Copy the code and paste it in a new cell and run it. If your python already
installed the Folium module and there is no error, you should see a dynamic
map as in the following figure.
That's all this post on how to create both static and dynamic maps using
ChatGPT. With this post, we hope to showcase the potential of ChatGPT in
collecting data and creating visualizations with maps. As we look ahead to the
future, we remain curious and excited about the possibilities that ChatGPT and
other advanced technologies will bring us. Thank you for reading!
Anyway I wrote a new post about how to automate GIS task with AI. This post exploring some topics about required tools, set up the system, connection testing, and performing automation task. If you're interested please check it out: How to Automate GIS Tasks with QGIS and AI: A Step-by-Step Guide


