The hurricane Harvey path made fall in Texas on Friday, August 26, 2017. The storm was categorized in four category, the most powerful hurricane in a decade that hit United States. Local media reported at least ten people have been killed and many more injured. The storm caused the rain that continued for several days and made the city in the hurricane's path received more than 30 inches of rain. The path of a hurricane can be tracked with radar data by measuring precipitation reflectivity. The
National Weather Service (NWS) operating Next Generation Radar (NEXTRAD) which consist of 159 high-resolution S-band Doppler weather radars. NEXTRAD detects atmospheric movement (wind) and precipitation. Then the data is presenting in a mosaic map that shows the pattern of precipitation and its movement. Therefore the NEXTRAD can be used to track the hurricane path almost in real time and can be used as early warning system to evacuate residence before a storm hit an area.
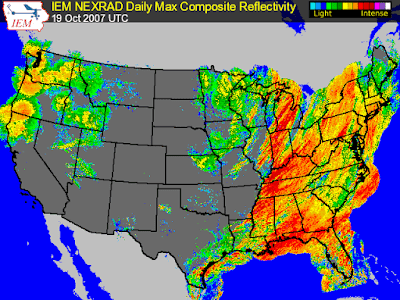 |
| Figure 1. NEXTRAD daily max composite reflectivity (Source: Iowa Environmental Mesonet) |
The NEXTRAD radar data is published publicly and can be accessed via
Unidata Internet Data Distribution (IDD). IDD is a community over 250 universities that disseminate near real time earth observation via internet. As soon as a dataset available from the observing system, a university can request the dataset to their site. IDD also designed to allow any site to inject a dataset into IDD, which make the system so flexible for data sharing.
Iowa Environmental Mesonet (IEM) of Iowa University is a member of IDD's community. IEM accessed the radar data of NEXTRAD from IDD every five minutes. A specific program in their server then process the data and composite the data into a large image. The product is a raster image with size 6000 x 2600 pixel in Portable Network Graphic (PNG) image format. The PNG image sometimes can not be used directly in GIS software. Therefore images in Geotiff format also available. Those images has EPSG:4326 projection (Lat/Lon) WGS84 ellipsoid.
The radar data also can be accessed with WMS-T. WMS stands for Web Map Service and T for time. WMS is an
Open Geospatial Consortium (OGC) standard for accessing online geospatial data. It returns static image from a server. While combining with Time, it will return a specific image for a certain time. With this capability, we can request an image at a specific time. Therefore we can track a hurricane path in a time range to make a time lapse.
The hurricane Harvey path time lapse in figure 2 shows the hurricane from early stage until it reached the land and swept the east coast from Corpus Christi to Houston. The time lapse was created from WMS-T data access in five days time range, starting from August 25, 2017 until August 29, 2017. Both started and finished at midnight UTC time. The hurricane started from the Gulf of Mexico on Friday, August 25, moved to the north and made landfall northeast of Corpus Christie.
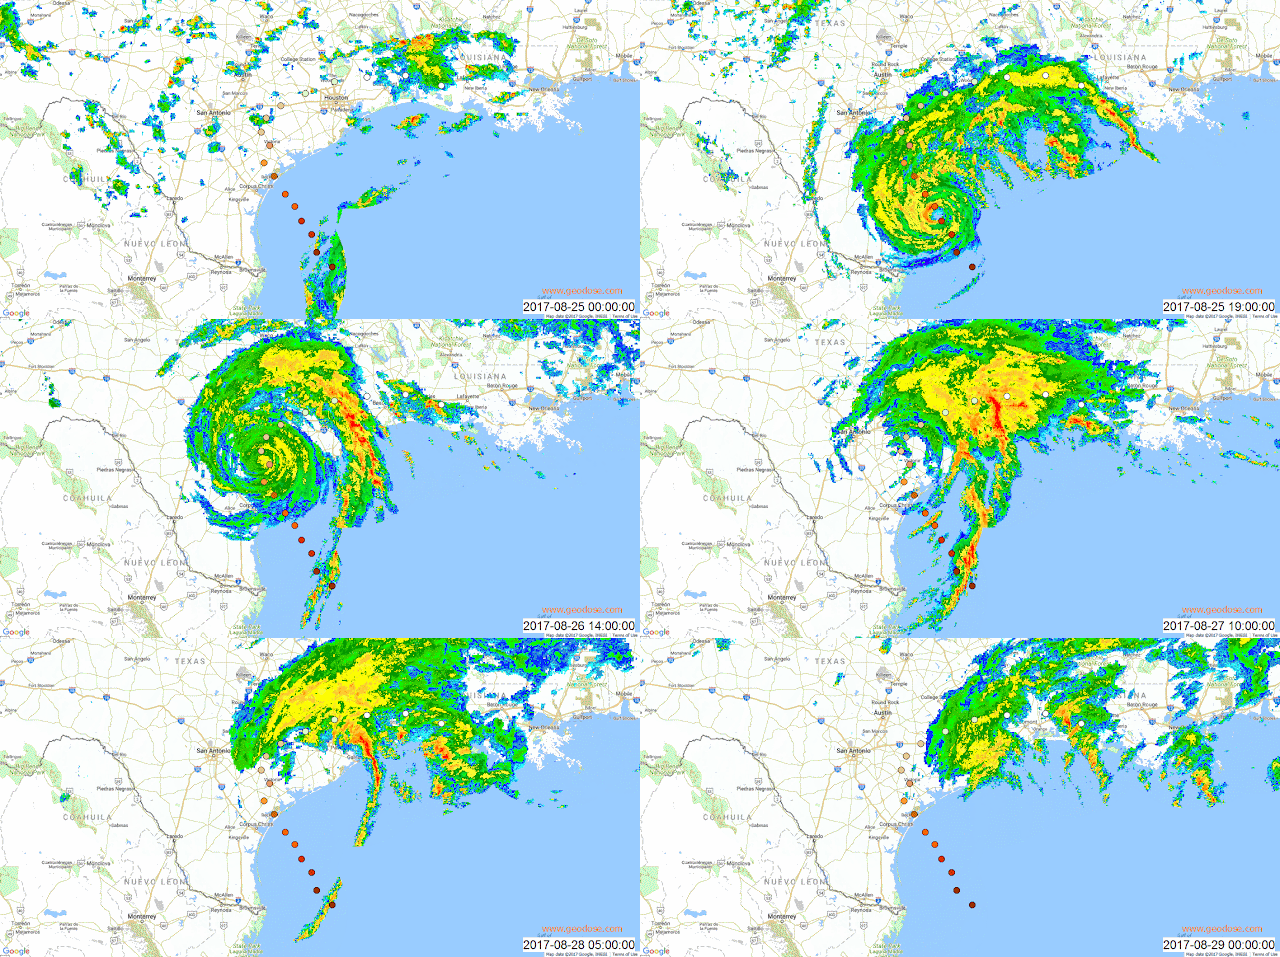 |
| Figure 2. The Hurricane Harvey path time lapse |
How to Create The Hurricane Harvey Path Time Lapse
We are moving to more technical part, how the hurricane Harvey path was created. For creating the time lapse it was used QGIS with Time Manager plugin. As stated above, the radar data from IEM NEXTRAD can be accessed via WMS-T service, then we can track the hurricane path movement time by time. Let's take a look step by step approach how to do it.
1. Firstly make sure the Time Manager plugin is installed in QGIS. You can refer to
this post how to check or install a plugin.
2. Add Google street basemap using Openlayers plugin.
3. Add NEXTRAD radar data with Add WMS/WMTS Layer tool. Make a new connection and fill the name of connection and the most important is URL path https://mesonet.agron.iastate.edu/cgi-bin/wms/nexrad/n0r-t.cgi?. See
figure 3.
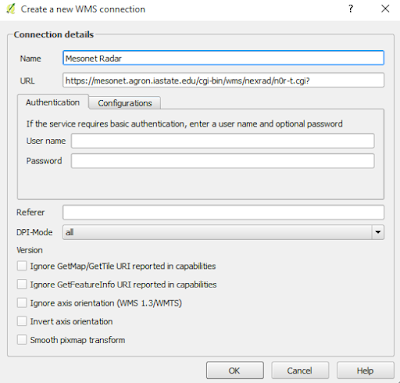 |
| Figure 3. Create a new WMS/WMTS connection |
4. Click Connect button to connect to IEM server. If succeeded, it will return some layers as in figure 4. Select the top layer and click Add button. If everything running well, the IEM WMS Service layer will be shown in the layer panel
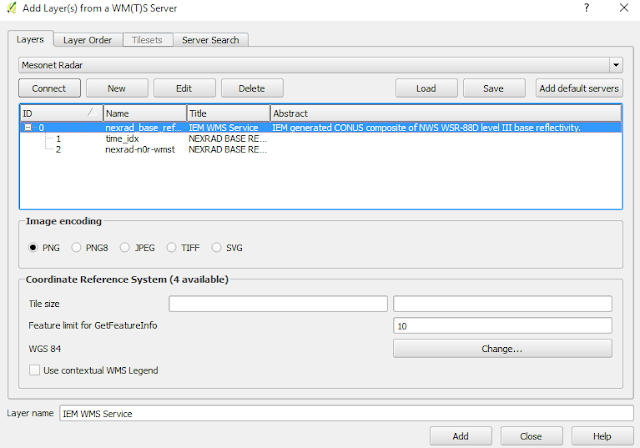 |
| Figure 4. Add IEM radar data layer |
5. Next we are ready to make the Hurricane Time lapse. For that, Open Time Manager plugin in menu plugins >> TimeManager >> Toggle visibility. See figure 5.
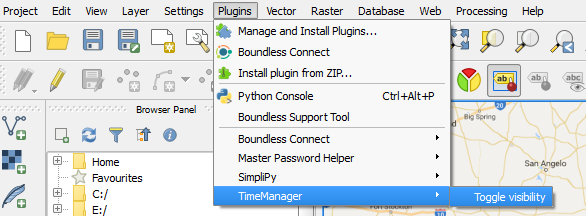 |
| Figure 5. Open Time Manager plugin |
6. The Time Manager plugin dialog box appears. Then click Settings button. Time manager settings dialog box will show up. Then click add Raster button. In the Select layer and column(s) dialog box choose IEM WMS Service for the Layer. Start time fill with 2017-08-25T00:00:00Z and End time 2017-08-29T00:00:00Z. See figure 6.
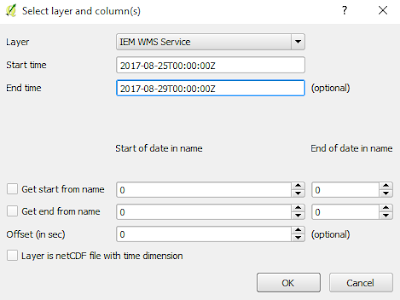 |
| Figure 6. Set start time and end time for IEM WMS Service data |
7. The speed of time lapse can be changed in the Animation Options. For this case I used 250 milliseconds. Higher number in this option will make the time lapse faster and vice versa. See figure 7.
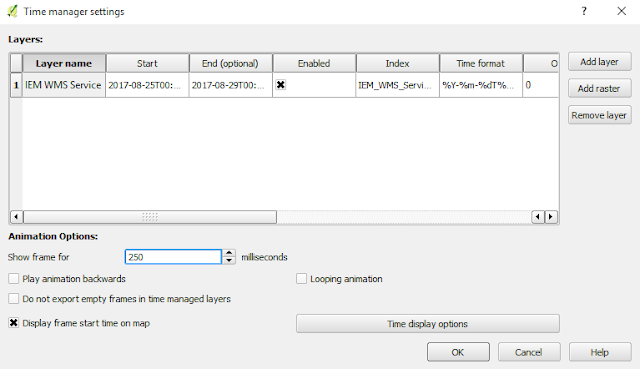 |
| Figure 7. Time manager settings |
8. Now you are ready to play the hurricane time lapse. In Time Manager dialog box set the Time frame size to 1 hours. It means the time of data which requested to the server has one hour step from start time until the end time. If everything already done. Click Play button. The hurricane path time lapse will run depends on you internet connection speed.
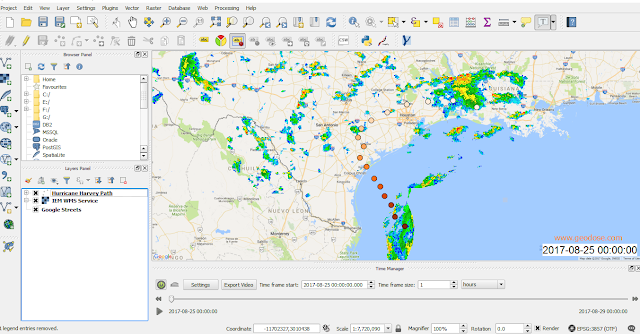 |
| Figure 8. The hurricane Harvey time lapse is ready to play |
9. Finally, the hurricane Harvey path time lapse can be exported to a video or animated gif picture. For that, just click Export Video Button, and choose an option that you want. Do not forget to set the speed of time lapse at Animation frame delay option. See figure 9.
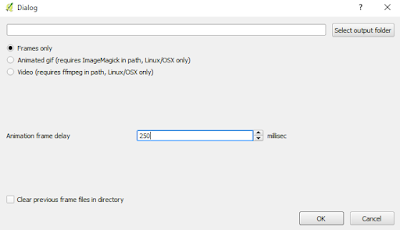 |
| Figure 9. Export the hurricane Harvey time lapse to video or animated gif |
That's all how to create the hurricane Harvey path time lapse from IEM NEXTRAD radar data. From the time lapse, we can track where the hurricane moved time by time. Lastly I hope the affected area will recover soon.
QGIS
Tutorial


